


주파수측정용


6–in–1 하나의 고성능 오실로스코프에서
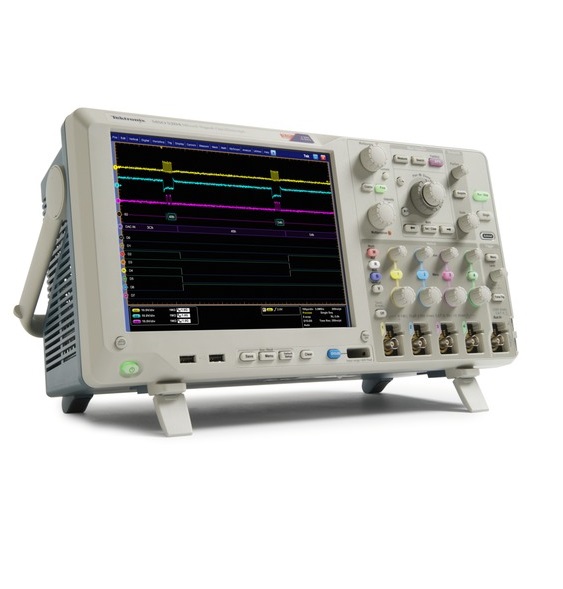
신제품 MDO4000C 혼합 도메인 오실로스코프
NEW MDO4000C Mixed Domain Oscilloscope
MDO4000C 오실로스코프는 강력한 트리거링, 검색 및 파형 분석을 가능하게 하는 긴 메모리를 제공합니다. 최대 6개의 내장 장비를 추가할 수 있으며, 각 장비는 까다로운 문제를 해결할 수 있는 뛰어난 성능을 제공합니다.
아날로그, 디지털 및 RF의 고유하고 동기화된 보기를 위해 스펙트럼, 로직 및 프로토콜 분석을 결합합니다. 무선 모듈 통합 또는 EMI 문제 해결과 관련된 어려움이 있다면 이 스코프가 가장 적합합니다.
| 특징 | 장점 |
| 20M 포인트 레코드 길이 | 더 오랜 시간 동안 세밀한 신호 정보를 확대하여 분해능을 유지할 수 있습니다. |
| Wave Inspector? 탐색 | 직관적인 전면 컨트롤을 사용해 원하는 신호를 쉽게 탐색합니다. 발생한 모든 이벤트를 자동으로 찾아 표시합니다. |
| FastAcq 고속 파형 캡처 | 초당 340,000개 이상의 파형을 통해 문제와 기타 비정상적인 과도 신호를 빠르게 식별합니다. 컬러 그레이딩을 사용해 관심 있는 이벤트를 쉽게 파악합니다. |
| 아날로그 채널 4개 – 디지털 채널 16개 및 RF 채널 1개(옵션) | 아날로그, 디지털 및 RF 신호 분석을 시간 동기화해 시스템 레벨 문제를 손쉽게 해결합니다. 모든 채널에서 트리거됩니다. |
| 넓은 대역폭을 갖춘 통합 스펙트럼 분석기 | -65dBc (일반) 동적 범위와 6GHz 주파수 범위로 RF 신호를 정확히 분석합니다. 최대 3.75GHz의 매우 넓은 캡처 대역폭을 통해 전체 스펙트럼을 동시에 볼 수 있습니다. |
| 통합 임의/함수 발생기 | 내장 50MHz 함수 발생기를 간편하게 사용할 수 있습니다. 오실로스코프와 128K 포인트 임의 파형 발생기를 통합하여 실제 신호를 손쉽게 캡처, 편집 및 재생할 수 있습니다. |
| 통합 로직 애널라이저 | 60.6ps까지의 타이밍 정밀도를 통해 설계의 디지털 부분을 디버깅합니다. 광범위한 시스템 가시성으로 시스템 타이밍 문제를 추적합니다. |
| 시리얼 버스 트리거링 및 분석 | 최대 세 개의 시리얼 버스에서 트리거링과 디코딩을 한 번에 자동화합니다. 관심 이벤트를 파악하는 시간을 절약하고 수동 번역 비트를 방지합니다. |
| 통합 디지털 전압계 및 주파수 카운터 | 제품을 등록하면, DC 전압, AC+DC RMS, AC RMS 및 주파수를 신속하게 측정할 수 있는 옵션을 무료로 제공합니다. |
| 업그레이드 가능성 | 아날로그 대역폭, 스펙트럼 분석기, 임의 함수 발생기, 디지털 채널(MSO), 시리얼 트리거 및 분석 패키지 등을 업그레이드할 수 있으므로 향후 변화에 적절하게 대처할 수 있습니다. |
| 모델 | 설명 | 데이터 시트 |
| Low Voltage Probe - Single End | ||
| TAP1500 | 액티브 프로브: 1.5GHz, 10X, 싱글 엔드, TekVPI |  |
| Current Probe | ||
| TCP0020 | 프로브, AC/DC 전류, 20A, DC, xxMHz BW, TekVPI 인터페이스, 확인 가능한 교정 인증서 표준 | |
| TCP0030A | 프로브, AC/DC 전류, 30A, DC, DC - 120MHZ, TekVPI 인터페이스 포함, 확인 가능한 교정 인증서 표준 | |
| TCP0150 | 전류 프로브: 20MHz, 5mA - 212A, AC/DC, TekVPI | |
| Differential Probe - High Voltage | ||
| TDP0500 | 디퍼런셜 프로브: 500MHz, 5X/50X, +/- 42V, TekVPI | |
| TDP1000 | 디퍼런셜 프로브: 1GHz, 5X/50X, +/- 42V, TekVPI | |
| THDP0100 | 디퍼런셜 프로브, 100MHZ TekVPI 디퍼런셜 고전압 프로브 | |
| THDP0200 | 디퍼런셜 프로브, 200MHZ TekVPI 디퍼런셜 고전압 프로브 | |
| TMDP0200 | 디퍼런셜 프로브, 200MHZ TekVPI 디퍼런셜 중전압 프로브, TMPD0200 | |
| Passive Probe | ||
| TPP0502 | 패시브 프로브: 500MHz, 2X, TekVPI | |
| TPP1000 | 패시브 프로브: 1GHz, 10X, TekVPI | |
| High Voltage Probe - Single Ended | ||
| TPP0850 | 고전압 프로브: 800MHz, 50X, 2.5kV, 싱글 엔드, TekVPI | |
Specifications
All specifications are guaranteed unless noted otherwise. All specifications apply to all models unless noted otherwise.
1- Oscilloscope
| MDO4024C | MDO4034C | MDO4054C | MDO4104C | |
|---|---|---|---|---|
| Analog channels | 4 | 4 | 4 | 4 |
| Analog channel bandwidth | 200 MHz | 350 MHz | 500 MHz | 1 GHz |
| Rise time | 1.75 ns | 1 ns | 700 ps | 350 ps |
| Sample rate (1 ch) | 2.5 GS/s | 2.5 GS/s | 2.5 GS/s | 5 GS/s |
| Sample rate (2 ch) | 2.5 GS/s | 2.5 GS/s | 2.5 GS/s | 5 GS/s |
| Sample rate (4 ch) Without option SA3 or SA6 With option SA3 or SA6 | 2.5 GS/s 2.5 GS/s | 2.5 GS/s 2.5 GS/s | 2.5 GS/s 2.5 GS/s | 5 GS/s 2.5 GS/s |
| Record length (1 ch) | 20 M | 20 M | 20 M | 20 M |
| Record length (2 ch) | 20 M | 20 M | 20 M | 20 M |
| Record length (4 ch) | 20 M | 20 M | 20 M | 20 M |
| Digital channels with MDO4MSO option | 16 | 16 | 16 | 16 |
| Arbitrary Function Generator outputs with MDO4AFG option | 1 | 1 | 1 | 1 |
| Spectrum analyzer channels with option SA3 or SA6 | 1 | 1 | 1 | 1 |
| Spectrum analyzer frequency range | ||||
| With Option SA3 With Option SA6 | 9 kHz - 3 GHz 9 kHz - 6 GHz | 9 kHz - 3 GHz 9 kHz - 6 GHz | 9 kHz - 3 GHz 9 kHz - 6 GHz | 9 kHz - 3 GHz 9 kHz - 6 GHz |
Vertical system analog channels
- Hardware bandwidth limits
- ≥350 MHz models
- 20 MHz or 250 MHz
- 200 MHz models
- 20 MHz
- Input coupling
- AC, DC
- Input impedance
- 1 MΩ ±1% (13 pF), 50 Ω ±1%
- Input sensitivity range
- 1 MΩ
- 1 mV/div to 10 V/div
- 50 Ω
- 1 mV/div to 1 V/div
- Vertical resolution
- 8 bits (11 bits with Hi Res)
- Maximum input voltage
- 1 MΩ
- 300 VRMS CAT II with peaks ≤ ±425 V
- 50 Ω
- 5 VRMS with peaks ≤ ±20 V
- DC gain accuracy
- ±1.5% (±2.0% at 1mV/div), derated at 0.10%/°C above 30 °C
±3.0% for variable gain, derated 0.10%/°C above 30 °C
- Offset accuracy
- ±(0.005 * |offset - position| + DC Balance)
- DC balance
- 0.1 div with DC - 50Ω scope input impedance (50Ω BNC terminated)
- Channel-to-channel isolation (typical)
- Any two channels at equal vertical scale ≥100:1 at ≤100 MHz and ≥30:1 at >100 MHz up to the rated bandwidth
- Random noise
Vertical scale setting 50 Ω, RMS MDO4104C (all configurations) MDO40x4C (with option SA3 or SA6) MDO40x4C (without option SA3 or SA6) 1 mV/div 0.093 mV 0.084 mV 0.163 mV 100 mV/div 3.31 mV 2.37 mV 2.01 mV 1 V/div 24.27 mV 20.62 mV 20.51 mV
- Offset range
Volts/div setting Offset range 1 M Ω input 50 Ω input 1 mV/div to 50 mV/div ±1 V ±1 V 50.5 mV/div to 99.5 mV/div ±0.5 V ±0.5 V 100 mV/div to 500 mV/div ±10 V ±10 V 505 mV/div to 995 mV/div ±5 V ±5 V 1 V/div to 10 V/div ±100 V ±5 V 5.05 V/div to 10 V/div ±50 V NA
Horizontal system analog channels
- Time base range
- 1 GHz models (without option SA3 or SA6) and 1 GHz models (with option SA3 or SA6 with 2 channels enabled)
- 400 ps to 1000 s
- ≤ 500 MHz models and 1 GHz models (with option SA3 or SA6 and 4 channels enabled)
- 1 ns to 1000 s
- Maximum duration at highest sample rate (all/half channels)
- 1 GHz models (without option SA3 or SA6) and 1 GHz models (with option SA3 or SA6 with 2 channels enabled)
- 8/4 ms
- ≤ 500 MHz models and 1 GHz models (with option SA3 or SA6 and 4 channels enabled)
- 8/8 ms
- Time-base delay time range
- -10 divisions to 5000 s
- Channel-to-channel deskew range
- ±125 ns
- Time base accuracy
- ±5 ppm over any ≥1 ms interval
Trigger system
- Trigger modes
- Auto, Normal, and Single
- Trigger coupling
- DC, AC, HF reject (attenuates >50 kHz), LF reject (attenuates <50 kHz), noise reject (reduces sensitivity)
- Trigger holdoff range
- 20 ns to 8 s
- Trigger sensitivity
- Internal DC coupled
- 1 mV/div to 4.98 mV/div
- 1.8 div
- 5 mV/div to 9.98 mV/div
- 0.6 div
- 10 mV/div to 19.98 mV/div
- 1.2 div
- ≤20 mV/div
- 0.5 div
- Trigger level ranges
- Any input channel
- ±8 divisions from center of screen, ±8 divisions from 0 V when vertical LF reject trigger coupling is selected
- Line
- The line trigger level is fixed at about 50% of the line voltage.
- Trigger frequency readout
- Provides 6-digit frequency readout of triggerable events.
- Trigger types
- Edge
- Positive, negative, or either slope on any channel. Coupling includes DC, AC, HF reject, LF reject, and noise reject.
- Sequence (B-trigger)
- Trigger Delay by Time: 8 ns to 8 s. Or Trigger Delay by Events: 1 to 4,000,000 events. Not available when “Either” edge is selected.
- Pulse Width
- Trigger on width of positive or negative pulses that are >, <, =, ≠, or inside/outside a specified period of time.
- Timeout
- Trigger on an event which remains high, low, or either, for a specified time period (4 ns to 8 s).
- Runt
- Trigger on a pulse that crosses one threshold but fails to cross a second threshold before crossing the first again.
- Logic
- Trigger when any logical pattern of channels goes false or stays true for specified period of time. Any input can be used as a clock to look for the pattern on a clock edge. Pattern (AND, OR, NAND, NOR) specified for all input channels defined as High, Low, or Don’t Care.
- Setup and Hold
- Trigger on violations of both setup time and hold time between clock and data present on any of the analog and digital input channels.
Setup and hold trigger type Description Setup Time Range -0.5 ns to 1.024 ms Hold Time Range 1.0 ns to 1.024 ms Setup + Hold Time Range 0.5 ns to 2.048 ms - Rise/Fall Time
- Trigger on pulse edge rates that are faster or slower than specified. Slope may be positive, negative, or either and time range is 4.0 ns to 8 s.
- Video
- Trigger on all lines, odd, even, or all fields on NTSC, PAL, and SECAM video signals.
Custom bi-level and tri-level sync video standards.
- Extended Video (optional)
- Trigger on 480p/60, 576p/50, 720p/30, 720p/50, 720p/60, 875i/60, 1080i/50, 1080i/60, 1080p/24, 1080p/24sF, 1080p/25, 1080p/ 30, 1080p/50, 1080p/60, and custom bi-level and tri-level sync video standards.
Custom bi-level and tri-level sync video standards.
- Parallel (requires option MDO4MSO)
- Trigger on a parallel bus data value. Parallel bus can be from 1 to 20 bits (from the digital and analog channels) in size. Binary and Hex radices are supported.
Acquisition system
- Acquisition modes
- Sample
- Acquire sampled values.
- Peak Detect
- Captures glitches as narrow as 800 ps (MDO4104C with option SA3 or SA6 and ≤ 2 channels enabled or MDO4104C without SA3 or SA6) or 1.6 ns MDO4104C with option SA3 or SA6 and ≥ 3 channels enabled and all other models) at all sweep speeds
- Averaging
- From 2 to 512 waveforms included in average.
- Envelope
- Min-max envelope reflecting Peak Detect data over multiple acquisitions. Number of waveforms in the envelope selectable between 1 and 2000 and infinity
- Hi Res
- Real-time boxcar averaging reduces random noise and increases vertical resolution.
- Roll
- Scrolls waveforms right to left across the screen at sweep speeds slower than or equal to 40 ms/div.
- FastAcq?
- FastAcq optimizes the instrument for analysis of dynamic signals and capture of infrequent events, capturing >340,000 wfms/s on 1 GHz models and >270,000 wfms/s on 200 MHz - 500 MHz models.
Waveform measurements
- Cursors
- Waveform and Screen
- DC measurement accuracy
- ±((DC Gain Accuracy) * |reading - (Offset - Position)| + Offset Accuracy + 0.15 div + 0.6 mV)
- Automatic measurements (time domain)
- 30, of which up to eight can be displayed on-screen at any one time. Measurements include: Period, Frequency, Delay, Rise Time, Fall Time, Positive Duty Cycle, Negative Duty Cycle, Positive Pulse Width, Negative Pulse Width, Burst Width, Phase, Positive Overshoot, Negative Overshoot, Total Overshoot, Peak to Peak, Amplitude, High, Low, Max, Min, Mean, Cycle Mean, RMS, Cycle RMS, Positive Pulse Count, Negative Pulse Count, Rising Edge Count, Falling Edge Count, Area and Cycle Area.
- Automatic measurements (frequency domain)
- 3, of which one can be displayed on-screen at any one time. Measurements include Channel Power, Adjacent Channel Power Ratio (ACPR), and Occupied Bandwidth (OBW)
- Measurement statistics
- Mean, Min, Max, Standard Deviation.
- Reference levels
- User-definable reference levels for automatic measurements can be specified in either percent or units.
- Gating
- Isolate the specific occurrence within an acquisition to take measurements on, using either the screen or waveform cursors.
- Waveform histogram
- A waveform histogram provides an array of data values representing the total number of hits inside of a user-defined region of the display. A waveform histogram is both a visual graph of the hit distribution as well as a numeric array of values that can be measured.
- Sources
- Channel 1, Channel 2, Channel 3, Channel 4, Ref 1, Ref 2, Ref 3, Ref 4, Math
- Types
- Vertical, Horizontal
- Waveform histogram measurements
- 12, of which up to eight can be displayed on-screen at any one time. Waveform Count, Hits in Box, Peak Hits, Median, Max, Min, Peak-to-Peak, Mean, Standard Deviation, Sigma 1, Sigma 2, Sigma 3
Waveform math
- Arithmetic
- Add, subtract, multiply, and divide waveforms.
- Math functions
- Integrate, differentiate, FFT
- FFT
- Spectral magnitude. Set FFT Vertical Scale to Linear RMS or dBV RMS, and FFT Window to Rectangular, Hamming, Hanning, or Blackman-Harris.
- Spectrum math
- Add or subtract frequency-domain traces.
- Advanced math
- Define extensive algebraic expressions including waveforms, reference waveforms, math functions (FFT, Intg, Diff, Log, Exp, Sqrt, Abs, Sine, Cosine, Tangent, Rad, Deg), scalars, up to two user-adjustable variables and results of parametric measurements (Period, Freq, Delay, Rise, Fall, PosWidth, NegWidth, BurstWidth, Phase, PosDutyCycle, NegDutyCycle, PosOverShoot, NegOverShoot, TotalOverShoot, PeakPeak, Amplitude, RMS, CycleRMS, High, Low, Max, Min, Mean, CycleMean, Area, CycleArea, and trend plots). For example, (Intg(Ch1 - Mean(Ch1)) × 1.414 × VAR1)
Act on Event
- Events
- None, when a trigger occurs, or when a defined number of acquisitions complete (1 to 1,000,000)
- Actions
- Stop acquisition, save waveform to file, save screen image, print, AUX OUT pulse, remote interface SRQ, e-mail notification, and visual notification
- Repeat
- Repeat the act on event process (1 to 1,000,000 and infinity)
Video Picture mode (optional, requires DPO4VID)
- Sources
- Channel 1, Channel 2, Channel 3, Channel 4
- Video standards
- NTSC, PAL
- Contrast and brightness
- Manual and automatic
- Field selection
- Odd, Even, Interlaced
- Picture location on screen
- Selectable X and Y location, width and height adjustment, start line and pixel and line-to-line offset control.
Power measurements (optional, requires DPO4PWR)
- Power quality measurements
- VRMS, VCrest Factor, Frequency, IRMS, ICrest Factor, True Power, Apparent Power, Reactive Power, Power Factor, Phase Angle.
- Switching loss measurements
- Power loss
- Ton, Toff, Conduction, Total.
- Energy loss
- Ton, Toff, Conduction, Total.
- Harmonics
- THD-F, THD-R, RMS measurements. Graphical and table displays of harmonics. Test to IEC61000-3-2 Class A and MIL- STD-1399, Section 300A.
- Ripple measurements
- VRipple and IRipple.
- Modulation analysis
- Graphical display of +Pulse Width, -Pulse Width, Period, Frequency, +Duty Cycle, and -Duty Cycle modulation types.
- Safe operating area
- Graphical display and mask testing of switching device safe operating area measurements.
- dV/dt and dI/dt measurements
- Cursor measurements of slew rate
Limit-Mask testing (optional, requires DPO4LMT)
- Included standard masks 1
- ITU-T, ANSI T1.102, USB
1≥350 MHz bandwidth models are recommended for mask testing on telecomm standards >55 Mb/s. 1 GHz bandwidth models are recommended for mask testing on high-speed (HS) USB.
- Test source
- Limit test: Any Ch1 - Ch4 or any R1 - R4
Mask test: Any Ch1 - Ch4
- Mask creation
Limit test vertical tolerance from 0 to 1 division in 1 m division increments; Limit test horizontal tolerance from 0 to 500 m division in 1 m division increments
Load standard mask from internal memory
Load custom mask from text file with up to 8 segments
- Mask scaling
- Lock to Source ON (mask automatically re-scales with source-channel settings changes)
Lock to Source OFF (mask does not re-scale with source-channel settings changes)
- Test criteria run until
- Minimum number of waveforms (from 1 to 1,000,000 and Infinity)
Minimum elapsed time (from 1 second to 48 hours and Infinity)
- Violation threshold
- From 1 to 1,000,000
- Actions on test failure
- Stop acquisition, save screen image to file, save waveform to file, print screen image, trigger out pulse, set remote interface SRQ
- Actions on test complete
- Trigger out pulse, set remote interface SRQ
- Results display
- Test status, total waveforms, number of violations, violation rate, total tests, failed tests, test failure rate, elapsed time, total hits for each mask segment
2- Spectrum Analyzer (requires Option SA3 or SA6)
- Span
1 kHz - 3 GHz (models with option SA3) or 1 kHz - 6 GHz (models with option SA6)
Span adjustable in a 1-2-5 sequence
Variable resolution = 1% of the next span setting
- Resolution bandwidth range
The resolution bandwidth range for windowing functions is as follows:
Kaiser (default): 20 Hz - 200 MHz
Rectangular: 10 Hz - 200 MHz
Hamming: 10 Hz - 200 MHz
Hanning: 10 Hz - 200 MHz
Blackman-Harris: 20 Hz - 200 MHz
Flat-top: 30 Hz - 200 MHz
Adjusted in a 1-2-3-5 sequence
- RBW shape factor (Kaiser)
- 60 dB / 3 dB shape factor: ≥ 4:1
- Reference level
- Setting range: -140 dBm to +30 dBm in steps of 1 dB
- Input vertical range
- Vertical measurement range: +30 dBm to DANL
Vertical setting of 1 dB/div to 20 dB/div in a 1-2-5 sequence
- Vertical position
- -100 divs to +100 divs
- Vertical units
- dBm, dBmV, dBµV, dBµW, dBmA, dBµA
- Displayed average noise level (DANL)
Frequency range DANL 9 kHz - 50 kHz < -116 dBm/Hz (< -123 dBm/Hz, typical) 50 kHz – 5 MHz < -130 dBm/Hz (< -141 dBm/Hz, typical)
울산광역시 남구 정동로 11-1(삼산동 1600-7) | 전화번호 : 052-272-8461~2 | 팩스번호 : 052-272-8463
COPYRIGHT © www.dongasystem.co.kr. All rights reseved